Motorized individual travel
The electricity demand data of motorized individual travel (MIT) for both the eGon2035
and eGon100RE scenario is set up in the
MotorizedIndividualTravel
dataset.
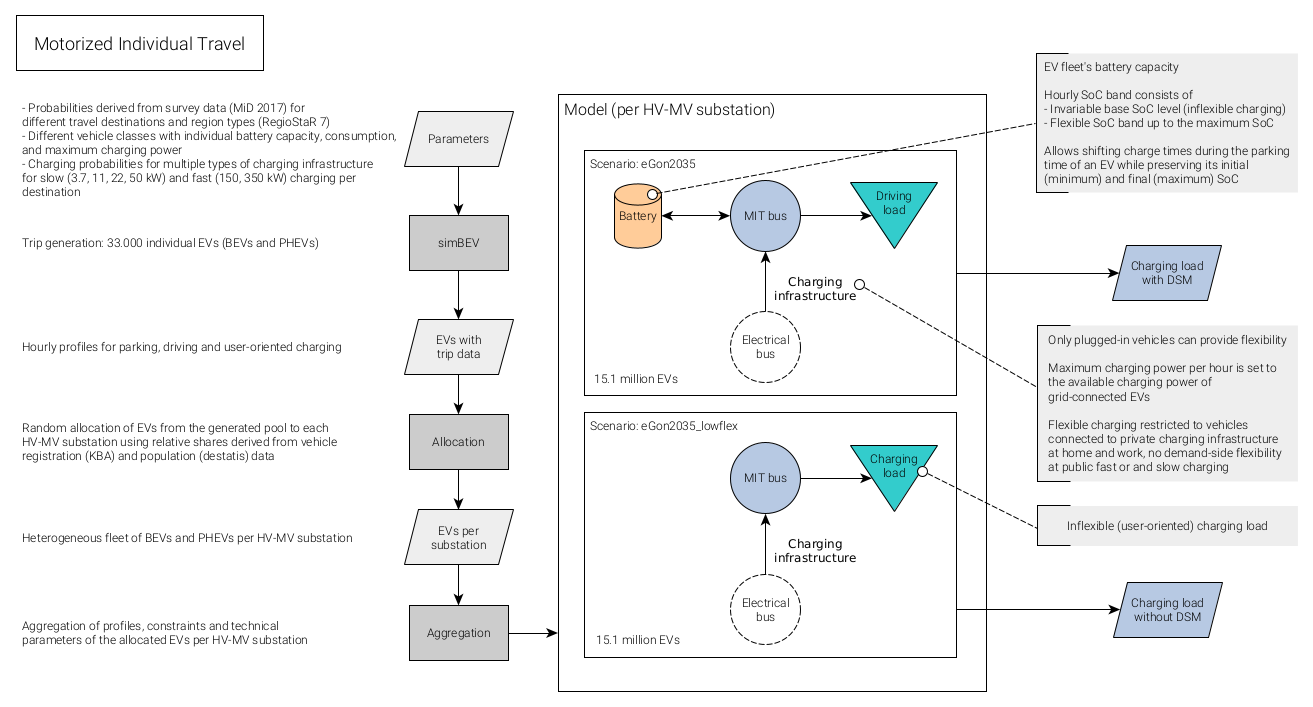
For the eGon2035, the workflow is visualised in figure Workflow to set up charging demand data for MIT in the eGon2035 scenario. The workflow
for the eGon100RE scenario is analogous to the workflow for the eGon2035 scenario.
In a first step, pre-generated SimBEV trip data, including information on driving, parking and
(user-oriented) charging times is downloaded.
In the second step, the number of EVs in each MV grid district in the future scenarios is determined.
Last, based on the trip data and the EV numbers, charging time series as well as
time series to model the flexibility of EVs are set up.
In the following, these steps are explained in more detail.
Workflow to set up charging demand data for MIT in the eGon2035 scenario
The trip data are generated using a modified version of
SimBEV v0.1.3.
SimBEV generates driving and parking profiles for battery electric vehicles (BEVs) and
plug-in hybrid electric vehicles (PHEVs) based on MID survey data [MiD2017] per
RegioStaR7 region type [RegioStaR7_2020].
The data contain information on energy consumption during the drive, as well as on
the availability of charging points at the parking
location and in case of an available charging point the corresponding charging demand,
charging power and charging point use case
(home charging point, workplace charging point, public charging point and fast charging
point).
Different vehicle classes are taken
into account whose assumed technical data is given in table Differentiated EV types and corresponding technical data.
Moreover, charging probabilities for multiple types of charging
infrastructure are presumed based on [NOW2020] and [Helfenbein2021].
Given these assumptions, trip data for a pool of 33.000 EV-types is pre-generated and provided through the data bundle
(see Data bundle). The data is as well written to database tables
EgonEvTrip,
containing information on the driving and parking times of each EV,
and EgonEvPool,
containing information on the type of EV and RegioStaR7 region the trip data corresponds to.
The complete technical data and assumptions of the SimBEV run can be found in the
metadata_simbev_run.json file, that is provided along with the trip data through the data bundle.
The metadata is as well written to the database table
EgonEvMetadata.
Technology |
Size |
Max. slow charging capacity in kW |
Max. fast charging capacity in kW |
Battery capacity in kWh |
Energy consumption in kWh/km |
|---|---|---|---|---|---|
BEV |
mini |
11 |
120 |
60 |
0.1397 |
BEV |
medium |
22 |
350 |
90 |
0.1746 |
BEV |
luxury |
50 |
350 |
110 |
0.2096 |
PHEV |
mini |
3.7 |
40 |
14 |
0.1425 |
PHEV |
medium |
11 |
40 |
20 |
0.1782 |
PHEV |
luxury |
11 |
120 |
30 |
0.2138 |
The assumed total number of EVs in Germany is 15.1 million in the eGon2035 scenario (according
to the network development plan [NEP2021] (Scenario C 2035)) and 25 million in the
eGon100RE scenario (own assumption).
To spatially disaggregate the charging demand, the total number of EVs per EV type
is first allocated to MV grid districts based on vehicle registration [KBA] and population [Census] data
(see function allocate_evs_numbers).
The resulting number of EVs per EV type in each MV grid district in each scenario is written to the database table
EgonEvCountMvGridDistrict.
Each MV grid district is then assigned a random pool of EV profiles from the pre-generated
trip data based on the RegioStaR7 region [RegioStaR7_2020] the grid district is assigned to and the counts
per EV type
(see function allocate_evs_to_grid_districts).
The results are written to table
EgonEvMvGridDistrict.
On the basis of the assigned EVs per MV grid district and the trip data, charging demand time series in each MV grid district can be determined. For inflexible charging (see lower right in figure Workflow to set up charging demand data for MIT in the eGon2035 scenario) it is assumed that the EVs are charged with full power as soon as they arrive at a charging station until they are fully charged. The respective charging power and demand is obtained from the trip data. The individual charging demand time series per EV are summed up to obtain the charging time series per MV grid district. The generation of time series to model flexible charging of EVs (upper right in figure Workflow to set up charging demand data for MIT in the eGon2035 scenario) is described in section Flexible charging of EVs.
For grid analyses of the MV and LV level, the charging demand needs to be further disaggregated within the MV grid districts. To this end, potential charging sites are determined. These potential charging sites are then used to allocate the charging demand of the EVs in each MV grid district to specific charging points. This allocation is not done in eGon-data but in the eDisGo tool and further described in the eDisGo documentation.
The determination of potential charging sites is conducted in class
MITChargingInfrastructure.
The results are written to database table
EgonEmobChargingInfrastructure.
The approach used to determine potential charging sites is based on the method implemented in
TracBEV.
Four use cases for charging points are differentiated - home, work, public and high-power charging (hpc).
The potential charging sites are determined based on geographical data. Each
possible charging site is assigned an attractivity that represents the likelihood that a
charging point is installed at that site.
The used approach is for each use case shortly described in the following:
Home charging: The allocation of home charging stations is based on the number of apartments in each 100 x 100 m grid given by the Census 2011 [Census]. The cell with the highest number of apartments receives the highest attractivity.
Work charging: The allocation of work charging stations is based on the area classification obtained from OpenStreetMap [OSM] using the landuse key. Work charging stations are allocated to areas tagged with commercial, retail or industrial. The attractivity of each area depends on the size of the area as well as the classification. Commercial areas receive the highest attractivity, followed by retail areas. Industrial areas are ranked lowest.
Public charging (slow): The basis for the allocation of public charging stations are points of interest (POI) from OSM [OSM]. POI can be schools, shopping malls, supermarkets, etc. The attractivity of each POI is determined by empirical studies conducted in previous projects.
High-power charging: The basis for the allocation of fast charging stations are the locations of existing petrol stations obtained from OSM [OSM]. The locations are ranked randomly at the moment.
The necessary input data is downloaded from zenodo.
Heavy-duty transport
In the context of the eGon project, it is assumed that all e-trucks will be
completely hydrogen-powered. The hydrogen demand data of all e-trucks is set up
in the HeavyDutyTransport
dataset for both the eGon2035 and eGon100RE scenario.
In both scenarios the hydrogen consumption is assumed to be 6.68 kgH2 per 100 km with an additional supply chain leakage rate of 0.5 % (see here).
For the eGon2035 scenario the ramp-up figures are taken from the network development plan [NEP2021] (Scenario C 2035). According to this, 100,000 e-trucks are expected in Germany in 2035, each covering an average of 100,000 km per year. In total this means 10 Billion km.
For the eGon100RE scenario it is assumed that the heavy-duty transport is completely hydrogen-powered. The total freight traffic with 40 Billion km is taken from the BMWK Langfristszenarien for heavy-duty vehicles larger 12 t allowed total weight (SNF > 12 t zGG).
The total hydrogen demand is spatially distributed on the basis of traffic volume data from [BASt].
For this purpose, first a voronoi partition of Germany using the traffic measuring points is created.
Afterwards, the spatial shares of the Voronoi regions in each NUTS3 area are used to allocate
hydrogen demand to the NUTS3 regions and are then aggregated per NUTS3 region.
The refuelling is assumed to take place at a constant rate.
Finally, to
determine the hydrogen bus where the hydrogen demand is allocated to, the centroid
of each NUTS3 region is used to determine the respective hydrogen Voronoi cell (see
GasAreaseGon2035 and
GasAreaseGon100RE) it is
located in.