Heat demand of residential as well as commercial, trade and service (CTS) buildings can be supplied by different technologies and carriers. Within the data model creation, capacities of supply technologies are assigned to specific locations and their demands. The hourly dispatch of heat supply is not part of the data model, but a result of the grid optimization tools.
In general, heat supply can be divided into three categories which include specific technologies: residential and CTS buildings in a district heating area, buildings supplied by individual heat pumps, and buildings supplied by conventional gas boilers. The shares of these categories are taken from external sources for each scenario.
District heating |
Individual heat pumps |
Individual gas boilers |
|
|---|---|---|---|
eGon2035 |
69 TWh |
27.24 TWh |
390.78 TWh |
eGon100RE |
61.5 TWh |
311.5 TWh |
0 TWh |
The following subsections describe the heat supply methodology for each category.
District heating
First, district heating areas are defined for each scenario based on existing district heating areas and an overall district heating share per scenario. To reduce the model complexity, district heating areas are defined per Census cell, either all buildings within a cell are supplied by district heat or none. The first step of the extraction of district heating areas is the identification of Census cells with buildings that are currently supplied by district heating using the building dataset of Census. All Census cells where more than 30% of the buildings are currently supplied by district heat are defined as cells inside a district heating area.
The identified cells are then summarized by combining cells that have a maximum distance of 500m.
Second, additional Census cells are assigned to district heating areas considering the heat demand density. Assuming that new district heating grids are more likely in cells with high demand, the remaining Census cells outside of a district heating grid are sorted by their demands. Until the pre-defined national district heating demand is met, cells from that list are assigned to district heating areas. This can also result in new district heating grids which cover only a few Census cells.
To avoid unrealistic large district heating grids in areas with many cities close to each other (e.g. the Ruhr Area), district heating areas with an annual demand > 4 TWh are split by NUTS3 boundaries.
The implementation of the district heating area demarcation is done in DistrictHeatingAreas, the resulting data is stored in the tables demand.egon_map_zensus_district_heating_areas and demand.egon_district_heating_areas.
The resulting district heating grids for the scenario eGon2035 are visualized in figure Defined district heating grids in scenario eGon2035, which also includes a zoom on the district heating grid in Berlin.
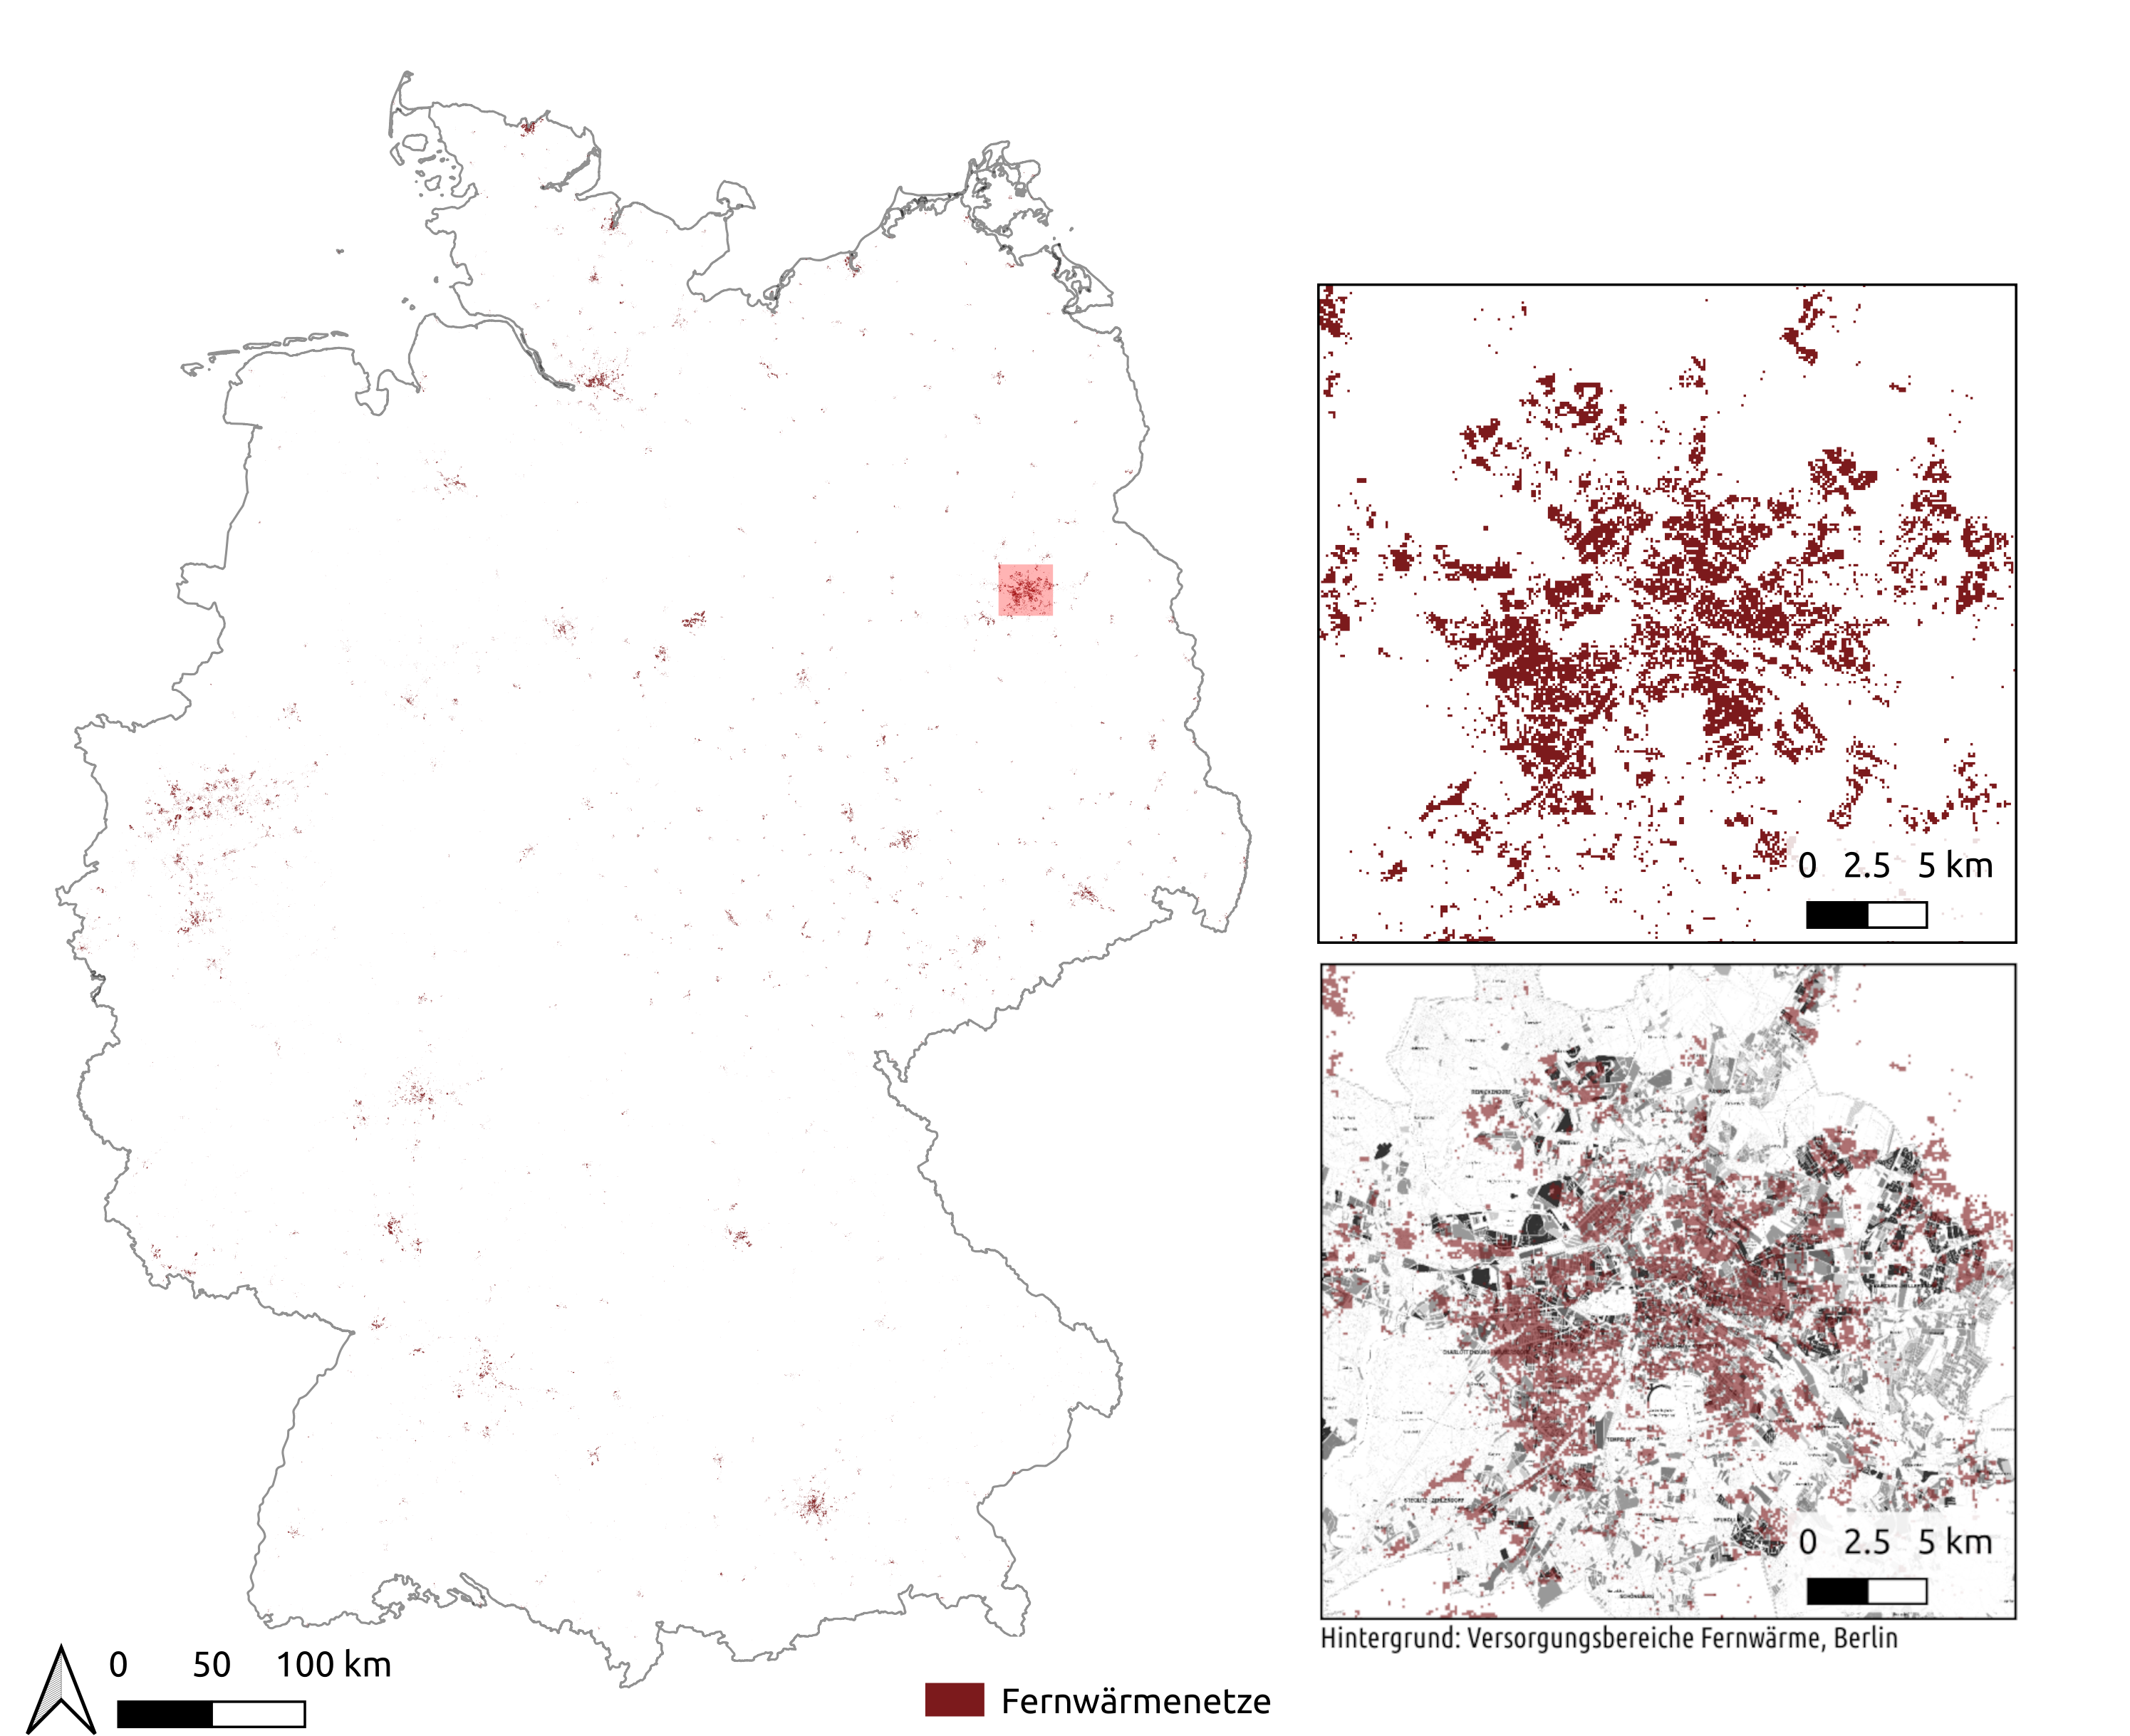
Defined district heating grids in scenario eGon2035
The national capacities for each supply technology are taken from the Grid Development Plan (GDP) for the scenario eGon2035, in the eGon100RE scenario they are the result of the pypsa-eur-sec run. The distribution of the capacities to district heating grids is done similarly based on [FfE2017], which is also used in the GDP. The basic idea of this method is to use a cascade of heat supply technologies until the heat demand can be covered.
Combined heat and power (CHP) plants are assigned to nearby district heating grids first. Their location and thermal capacities are from Marktstammdatenregister [MaStR]. To identify district heating grids that need additional suppliers, the remaining annual heat demand is calculated using the thermal capacities of the CHP plants and assumed full load hours.
Large district heating grids with an annual demand that is higher than 96GWh can be supplied by geothermal plants, in case of an intersection of geothermal potential areas and the district heating grid. Smaller district heating grids can be supplied by solar thermal power plants. The national capacities are distributed proportionally to the remaining heat demands. After assigning these plants, the remaining heat demands are reduced by the thermal output and assumed full load hours.
Next, the national capacities for central heat pumps and resistive heaters are distributed to all district heating areas proportionally to their remaining demands. Heat pumps are modeled with a time-dependent coefficient of performance (COP) depending on the temperature data. The COP is determined in function
heat_pump_copas part of theRenewableFeedindataset and written to database tablesupply.egon_era5_renewable_feedin.In the last step, gas boilers are assigned to every district heating grid regardless of the remaining demand. In the optimization, this can be used as a fall-back option to not run into infeasibilities.
The distribution of CHP plants for different carriers is shown in figure Spatial distribution of CHP plants in scenario eGon2035.
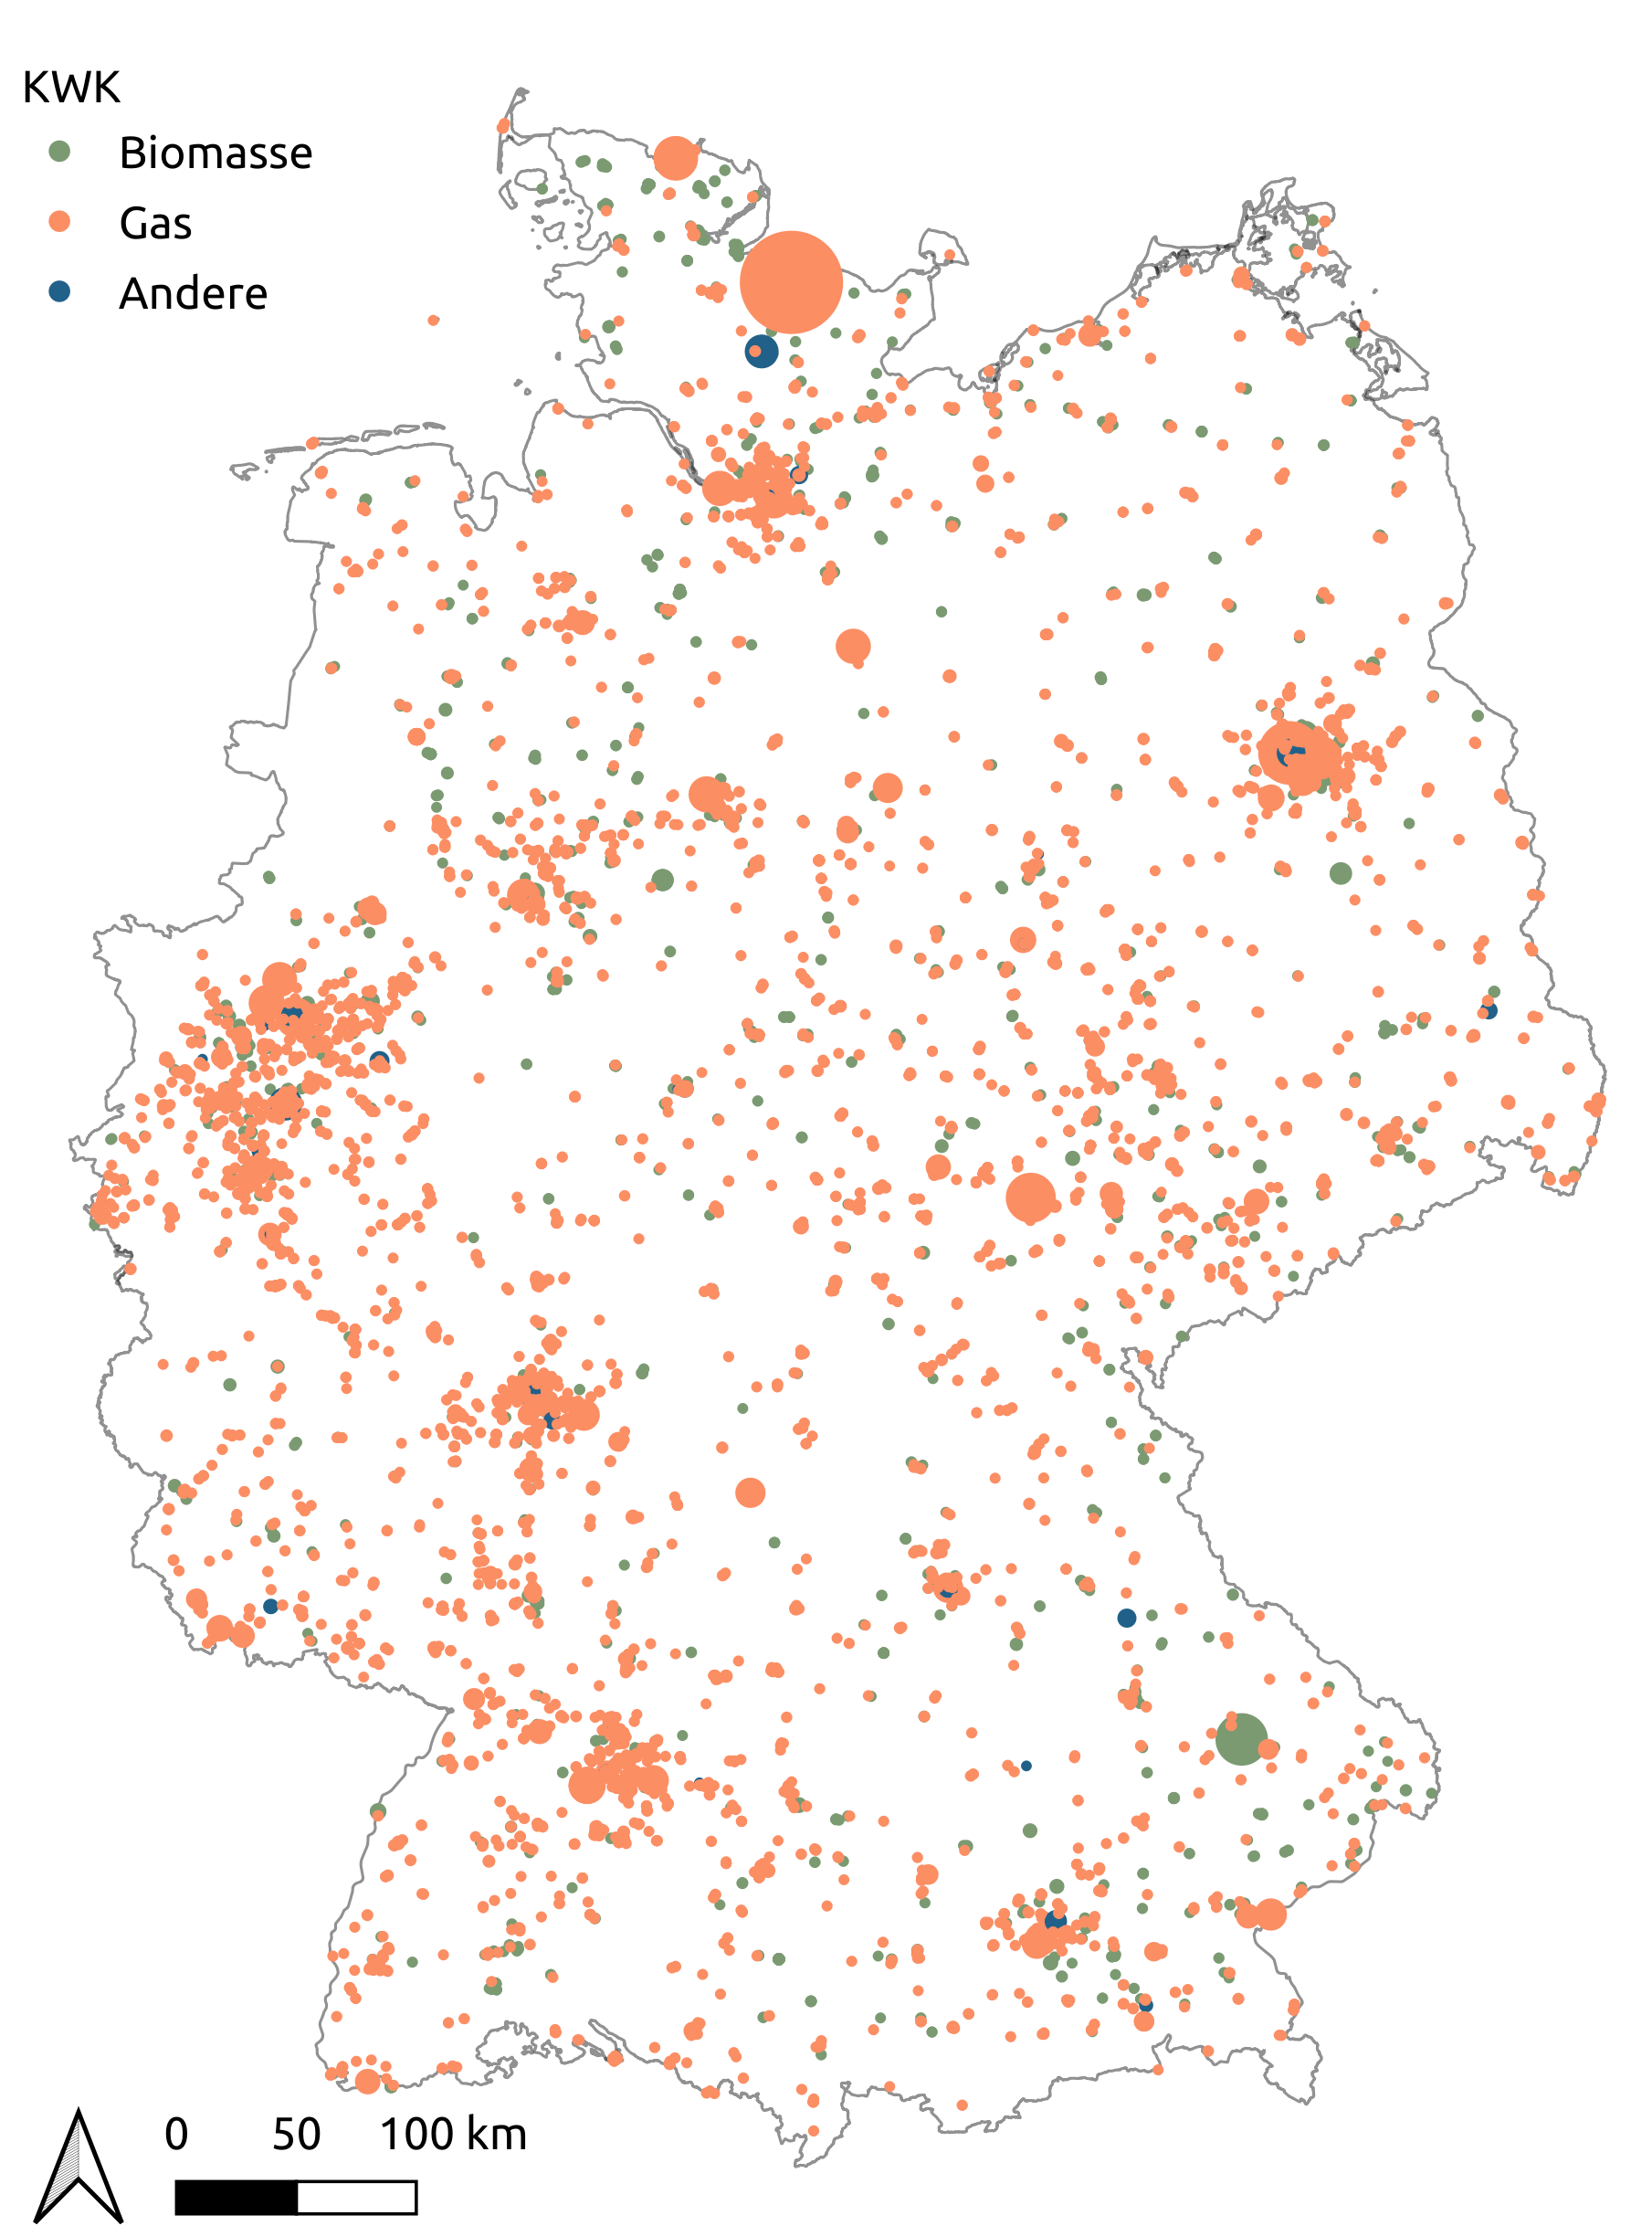
Spatial distribution of CHP plants in scenario eGon2035
Individual heat pumps
Heat pumps supplying individual buildings are first distributed to each medium-voltage grid district. These capacities are later on further disaggregated to single buildings. Similar to central heat pumps, individual heat pumps are modeled with a time-dependent coefficient of performance depending on the temperature data.
The distribution of the national capacities to each medium-voltage grid district is proportional to the heat demand outside of district heating grids.
The heat pump capacity per MV grid district is further disaggregated to individual
buildings based on the building’s peak heat demand.
For the eGon2035 scenario this is conducted in the dataset
HeatPumps2035
and for the eGon100RE scenario in the dataset
HeatPumps2050.
The heat pump capacity per building is for both scenarios written to database table
demand.egon_hp_capacity_buildings.
The peak heat demand per building is written to database table
demand.egon_building_heat_peak_loads.
To disaggregate the total heat pump capacity per MV grid, first, the minimum required heat pump capacity per building is determined. To this end, an approach from the network development plan (pp.46-47) is used where the heat pump capacity of a building is calculated by multiplying the peak heat demand of the building by a minimum assumed COP of 1.7 and a flexibility factor of 24/18 that is taking into account that power supply of heat pumps can be interrupted for up to six hours by the local distribution grid operator.
After the determination of the minimum required heat pump capacity per building, the
total heat pump capacity per MV grid district is distributed to buildings inside the
grid district based on the minimum required heat pump capacity.
In the eGon2035 scenario, heat pumps and gas boilers can be
used for individual heating. Therefore, it needs to be chosen which buildings
are assigned a heat pump and which are assigned a gas boiler. To this end,
buildings are randomly chosen until the MV grid’s total
heat pump capacity is reached (see
determine_buildings_with_hp_in_mv_grid).
Buildings with PV rooftop plants are set to be more likely to be assigned a heat pump. In case
the minimum heat pump capacity of all chosen buildings is smaller than the total
heat pump capacity of the MV grid but adding another building would exceed the total
heat pump capacity of the MV grid, the remaining capacity is distributed to all
buildings with heat pumps proportionally to their respective minimum required
heat pump capacity.
In the eGon100RE scenario, heat pumps are assumed to be the only technology for
individual heating, wherefore all buildings outside of district heating areas are
assigned a heat pump. The total heat pump capacity in the MV grid district is distributed
to all buildings with individual heating proportionally to the minimum required heat pump
capacity.
To assure that the heat pump capacity per MV grid district, that is in case
of the eGon100RE scenario optimised using PyPSA-EUR, is sufficient to meet the
minimum required heat pump capacity of each building, the minimum required heat pump capacity per
MV grid district is given as an input to the PyPSA-EUR optimisation.
Therefore, the minimum heat pump capacity per
building in the eGon100RE scenario is calculated and aggregated per grid district in the dataset
HeatPumpsPypsaEurSec
and written to csv file input-pypsa-eur-sec/minimum_hp_capacity_mv_grid_100RE.csv.
Drawbacks and limitations as well as challenges of the determination of the minimum
required heat pump capacity and the disaggregation to individual buildings
are discussed in the respective dataset docstrings of
HeatPumps2035,
HeatPumps2050 and
HeatPumpsPypsaEurSec.
Individual gas boilers
All residential and CTS buildings that are neither supplied by a district heating grid nor an individual heat pump are supplied by gas boilers. The demand time series of these buildings are multiplied by the efficiency of gas boilers and aggregated per methane grid node.
All heat supply categories are implemented in the dataset HeatSupply. The data is stored in the tables demand.egon_district_heating and demand.egon_individual_heating.